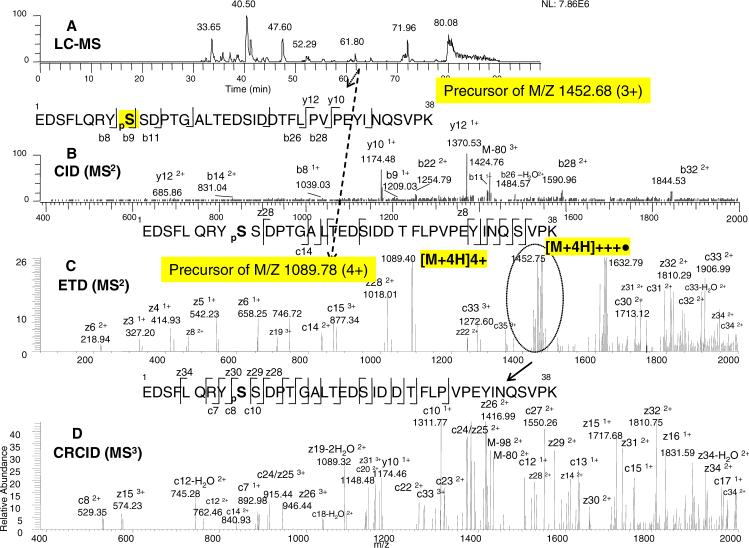
Figure 6. ERPA (CID / ETD) analysis of a serine phosphorylated peptide (pS 1046) from the Lys-C digest of EGFR.
A: Base peak ion chromatogram. B: CID-MS2 spectrum of the m/z 1452.68 (3+) ion. C: ETD-MS2 spectrum of the m/z 1089.78 (4+) ion. D: CRCID-MS3 scan of the m/z 1452.75 ion. (from the ETD spectrum as indicated by the dotted circle). The peptide sequences with the observed fragment ions are shown in the insert: phosphoserine is indicated as pS. The neutral loss of phosphate is also shown.

