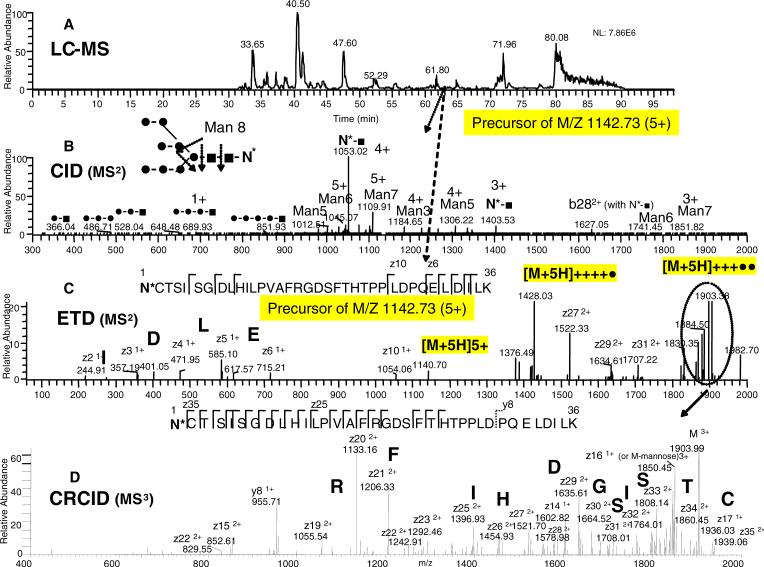
Figure 7. ERPA (CID / ETD) analysis of an N-linked glycosylated peptide fragment modified with a high-mannose-type glycan from the Lys-C digest of EGFR.
A: Base peak ion chromatogram. B: CID-MS2 spectrum of the m/z 1142.73 ion. C: ETD-MS2 spectrum of the m/z 1142.73 ion. D: CRCID-MS3 scan of the m/z 1903.38 ion (from the ETD spectrum as indicated by the dotted circle). The peptide sequence shown in the insert of panel C is identified through ETD fragmentation pattern. The glycosylation site is labeled N*. In the glycan structures, (•) represents mannose and (■) represents N-acetyl glucosamine. The sequential losses of terminal mannoses from the Man8 structure resulted in Man7, Man 6, etc., as indicated in panel B. The sequence tags of ELDI and CTSISGD are indicated in bold in the inserts of panels C and D, respectively.

