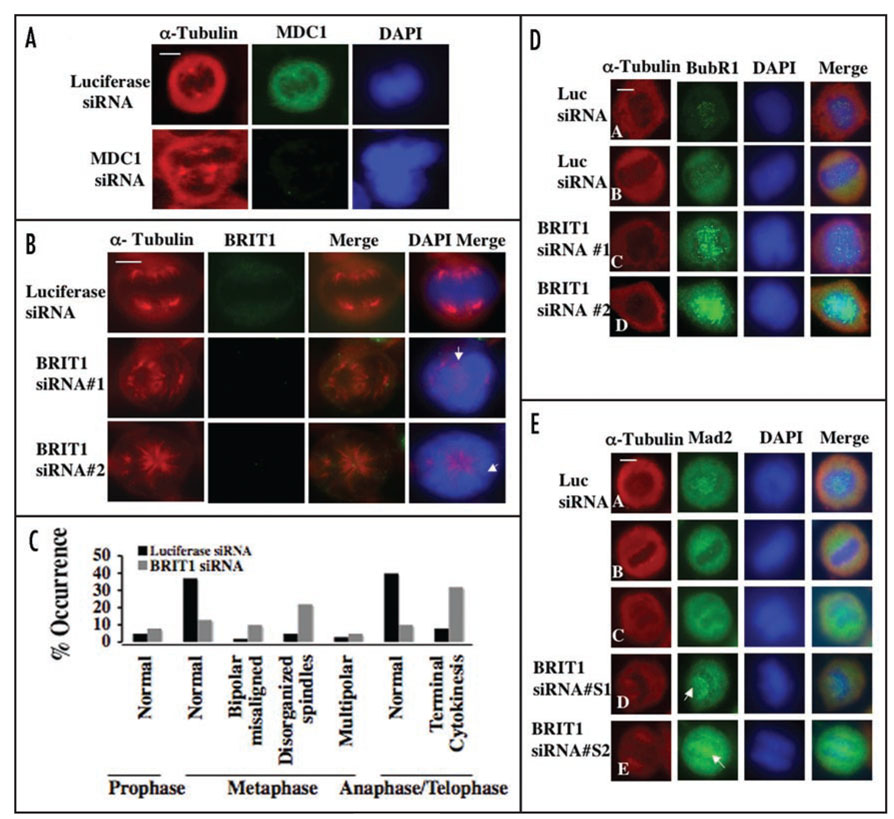
Figure 3. Depletion of MDC1 or BRIT1 leads to aberrant mitotic spindles and defective cytokinesis.
(A) U2OS cells grown on cover slips were mock-transfected or transfected with luciferase or MDC1 siRNAs. At 48 h after transfection, cells were fixed and costained with antibodies against α-tubulin and anti MDC1. Cells were washed and subsequently stained with Alexa Fluor dye-conjugated secondary antibodies. Nuclei were visualized with DAPI staining. Scale bar, 20 µm. Mitotic cells with abnormal spindles were captured. (B) Mock-transfected or BRIT1 siRNA-transfected U2OS cells were fixed and costained with antibodies against α-tubulin and BRIT1. Mitotic cells with abnormal spindles were captured. Scale bar, 20 µm. Arrows indicates misaligned spindle that failed to align properly to the equatorial plain, along with a chromosome congression failure at the metaphase. (C) Quantitative analysis of normal and defective mitotic cells observed in luciferase- or BRIT1 siRNA-treated cells. (D) α-tubulin and BubR1 (A, Prometaphase; B, Metaphase; C, Prometaphase; D, Metaphase) or (E) α-tubulin and Mad2 (A, Prometaphase; B, Metaphase; C, Anaphase; D, Metaphase; E, Anaphase) to analyze spindle checkpoint activation. Scale bar, 20 µm. Arrow indicates the persisten accumulation of Mad2 at the metaphase-anaphase transition.

