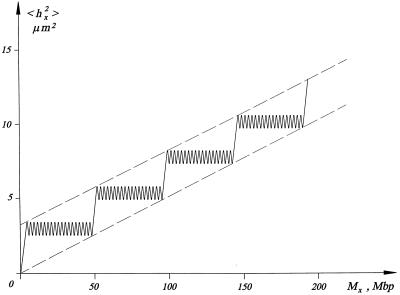
Figure 3.
Schematic drawing of the dependence of 〈hx2〉, mean-square geometrical distance, vs. Mx, genomic distance between two points on a G1 chromosome. The 〈hx2〉 vs. Mx dependence is due to chromosome tails and intermicelle links, because the net increase in 〈hx2〉 inside a micelle is zero. Dashed lines represent the boundaries of the experimental points. The model predicts that their slope (Bapp) is f-fold shallower than the initial slope (see Eq. 6), where f is the average number of loops per micelle.

