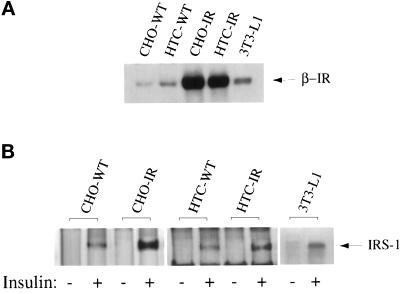
Figure 2.
Insulin receptor levels and insulin-stimulated IRS tyrosine phosphorylation in each of the cell lines. (A) Confluent cultures of CHO-WT, CHO-IR, HTC-WT, HTC-IR, and 3T3-L1 cells were serum deprived for 3 h and treated without or with 100 nM insulin (as indicated) for 5 min before preparation of total membranes, as outlined in MATERIALS AND METHODS. Equal amounts of total membrane protein were analyzed by immunoblotting with an anti-β-subunit insulin receptor antibody. Shown is one experiment representative of three. (B) Confluent cultures of CHO-WT, CHO-IR, HTC-WT, HTC-IR, and 3T3-L1 cells were serum deprived for 3 h and treated without or with 100 nM insulin (as indicated) for 5 min before preparation of whole cell lysates, as outlined in MATERIALS AND METHODS. Equal amounts of protein from untreated and insulin-stimulated lysates were immunoprecipitated with anti-PY and analyzed by immunoblotting with anti-PY antibody. The bands at a molecular weight of 185,000 represented the tyrosine phosphorylation of the IRS proteins.

