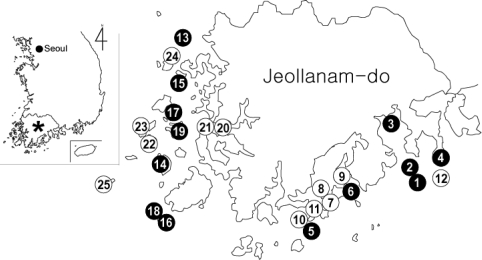
Fig. 1.
Map showing the surveyed islands and the distribution of cryptosporidiosis. The islands are illustrated with numbers, in accordance with Table 1. Islands with Cryptosporidium oocyst positive cases are in black circles and those without positive cases are shown in white circles.

