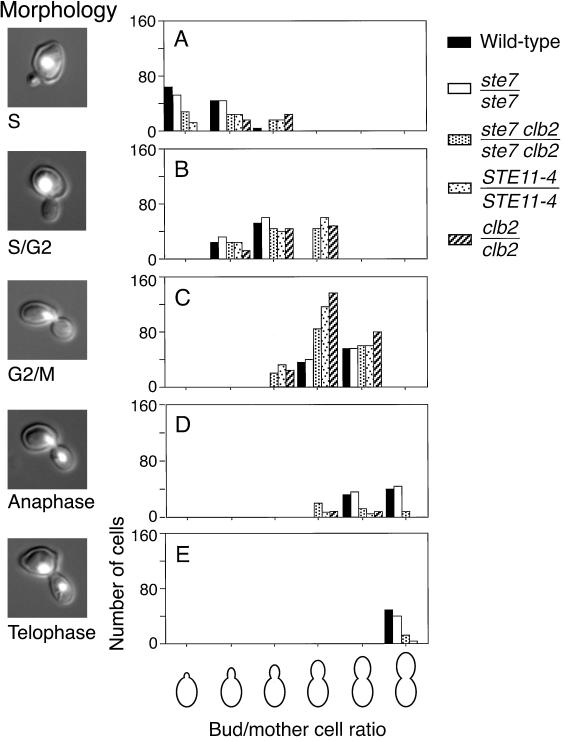
Figure 3.
Distribution of nuclear DNA through the budding cycle. Cells were grown on YPD rich media and fixed, and nuclear DNA was stained with DAPI as described in MATERIALS AND METHODS. The cell shapes and the positions and forms of nuclei in 400 budded cells were determined. Each cell was scored individually and classified into groups by apparent bud size/mother cell size ratio and into nuclear morphology classes corresponding to stages in the budding cycle. The histograms plot the number of cells that fall in one morphology class, divided into six groups by their bud size/mother cell size ratio. The five morphology classes plotted are: central nucleus, S phase (A); nucleus at neck in mother cell, S phase/G2 (B); nucleus distributed across neck, G2/metaphase (C); nucleus stretched along mitotic spindle, anaphase (D); and separate nuclear masses but no septum formed, telophase (E). Representative cells are shown to the left of each histogram. These data show that mitotic progression correlates well with bud growth in wild-type cells. By contrast, STE11-4 and clb2/clb2 mutants display an overabundance of G2/metaphase nuclei throughout the budded period and a decreased proportion of anaphase and telophase morphologies. This phenotype is suggestive of a postreplication delay analogous to that of filamentous cells cultured on nitrogen starvation media. The ste7/ste7 clb2/clb2 mutant reveals a slight increase in the proportion of cells in anaphase compared with clb2/clb2 but still significantly fewer compared with the wild-type control or the ste7/ste7 mutant.

