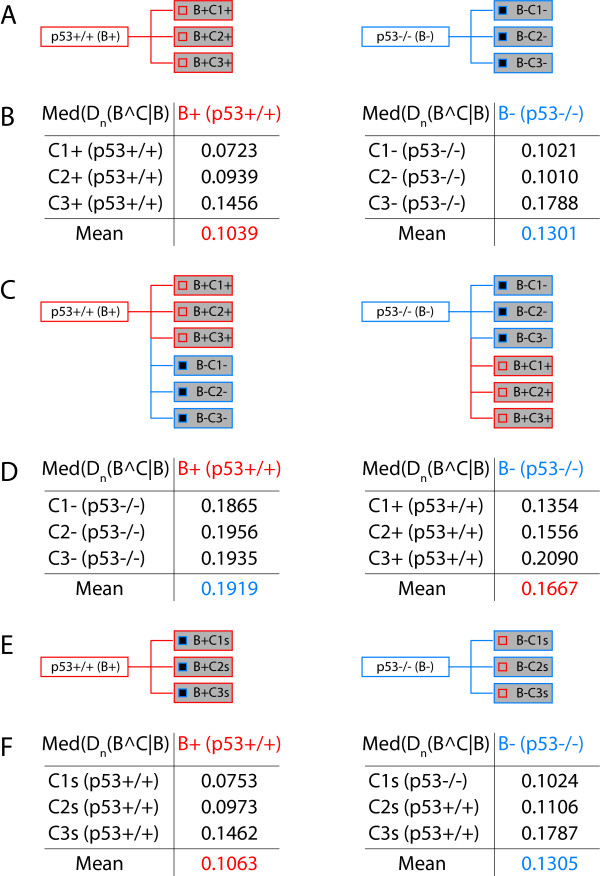
Figure 8.
A concrete example of circumstantial context analysis using transcriptome data. (A) Schematic representation of the two biological conditions (B+ p53+/+, B- p53-/-), and the three biological replicates (C1, C2, C3) from the published study [8]. The small squares inside the rectangles for the biological replicates represent the 899 probes that are statistically significantly regulated between the two biological conditions and should be considered p53 regulated genes. (B) Median of the Kullback-Leibler divergence measures for the indicated comparisons. The mean of the median of the divergence for the three comparisons is also indicated. (C) Schematic illustration of the subsequent divergence analysis, where the biological replicates of one biological condition are analyzed with respect to the other biological condition. (D) The data for the experiment illustrated in (C) are shown in a similar manner to (B). (E) The probability profiles for the 899 p53 statistically significantly regulated probes were swapped between the two biological conditions. (Compare the small squares inside the rectangles of the biological replicates). (F) Results for the experiment illustrated in (E) as in (B, D). The data should be compared to the data in (B).

