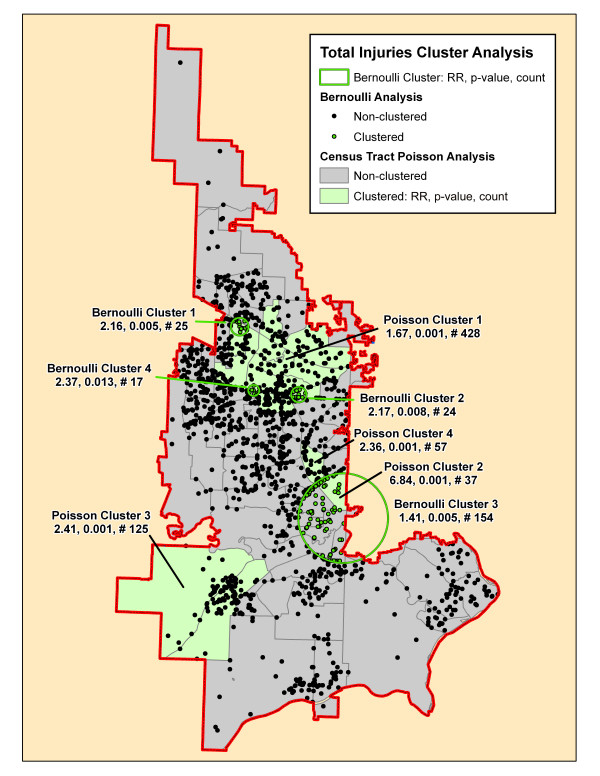
Figure 4.
Total injuries cluster analysis. The significant clusters by the SaTScan Poisson (green-shaded census tracts) and Bernoulli (green circles and green incident locations) methods are superimposed on this map. Each cluster is identified by its rank followed by its relative risk (RR), associated p-value and the number of cases in the cluster.

