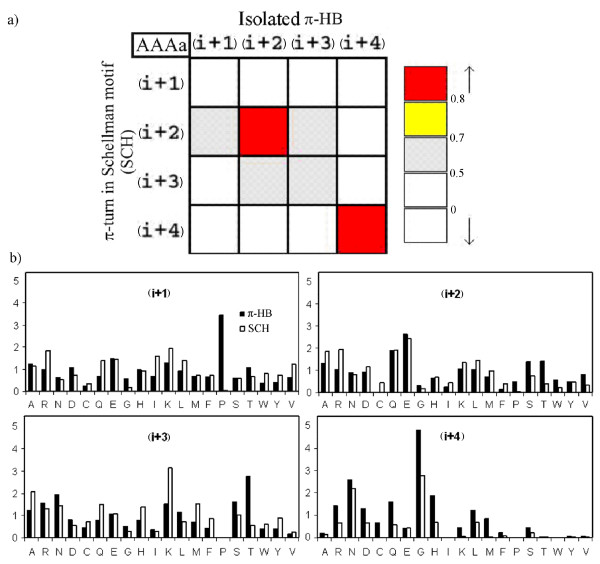
Figure 5.
a) Comparison of residue composition in π-turns of the type AAAa between isolated (π-HB) and those with the Schellman motif (SCH). Correlation coefficient matrix is color-coded and the range of values associated to each color is shown. b) Position-specific propensity profiles of residues occurring with the conformation AAAa, where they occur in isolation (π-HB) and at the end of helices (SCH).

