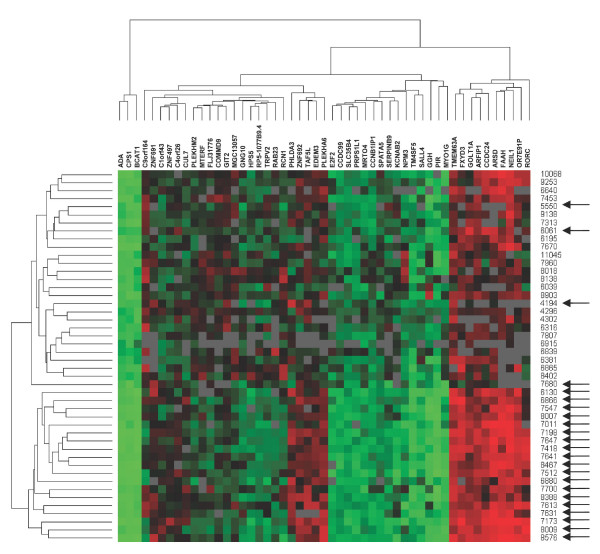
Figure 1.
Hierarchical clustering of the 46 tumours and 51 genes using Euclidian distance and average linkage (UPGMA). Green represents negative values compared to the reference, red represents positive values, black represents 0, and grey represents missing values. Arrows indicate samples from patients that survived more than 10 years after diagnosis. Patients separated into two distinct clusters, one containing all deceased, together with only four survivors. The other cluster contained only tumours from survivors. Genes separated into four main clusters, characterized by distinct patterns of up- or down-regulation.

