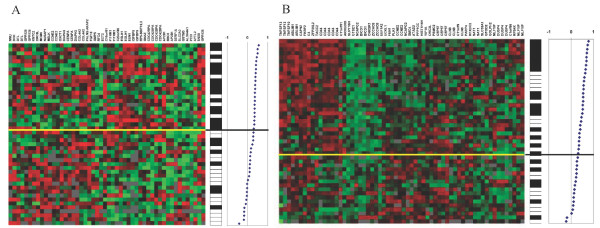
Figure 3.
Correlation-based classification of our tumours using other gene lists. A, Classification of our tumours using van't Veer's genes, 72% accuracy and 73% NPV. B, Classification of our tumours using Wang's genes, 61% accuracy and 59% NPV. Black bars represent 10-year survivors while white bars represent patients that died within ten years from diagnosis.

