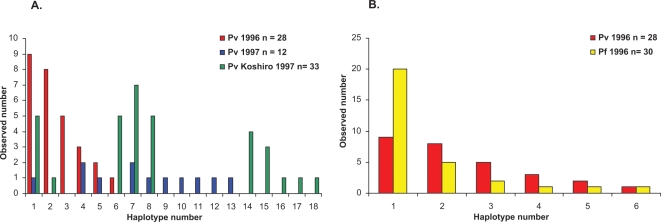
Figure 1. Graphical representation of the distributions of the Pvama1 and Pfama1 allele frequencies from the Venezuelan Amazon.
A. Distribution of 18 Pvama1 haplotypes across surveys in 1996 and 1997. Sequences from the additional village sampled in 1997 (Koshiro) are presented separately from those of the villages sampled in both surveys. B. Haplotype frequency distribution for Pfama1 and Pvama1 from the 1996 survey only.

