Figure 5.
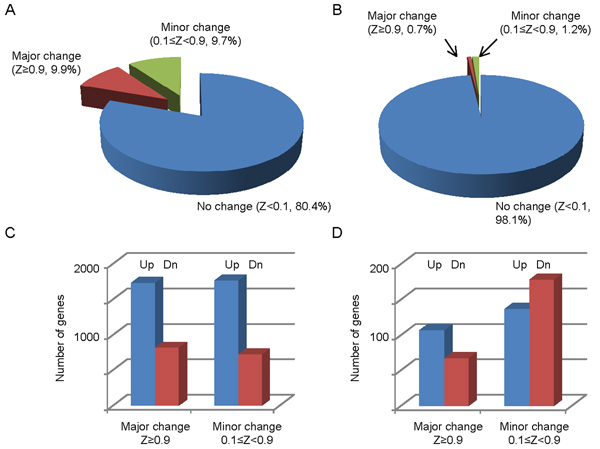
Changes of Pol II binding quantity in wild type MCF7 cells and OHT-resistant MCF7 cells before and after E2 treatment. Percentage of genes with no change (Z < 0.1), minor change (0.1 ≤ Z < 0.9), and major change (Z ≥ 0.9) in (A) wild type MCF7 cells and (B) OHT-resistant MCF7 cells. Number of genes with increased and decreased Pol II binding quantity in (C) wild type MCF7 cells and (D) OHT-resistant MCF7 cells. Dn = Down.

