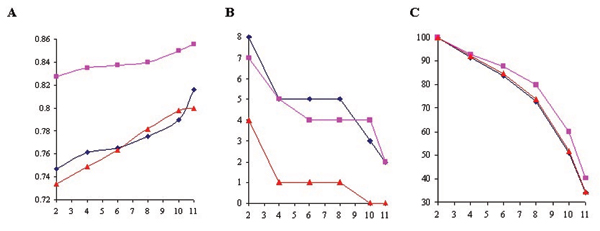
Figure 2.

Assessment of minimal number of replicates. Blue line: Fum/O2; pink line: Fe/O2; and red line: Fe/Fum. X-axis: minimal number of replicates. (A) Plot of r values with different minimal number of replicates. Y-axis: r values comparing the results from type 1 and 2 approaches. (B) Number of genes in opposite categories (induction vs. repression) with different minimal numbers of replicates. Y-axis: numbers of genes. (C) Total number of genes with different minimal numbers of replicates. Total number of genes was set to 100% when minimal number of replicates was 2, and the total number of genes at other minimal number of replicates was normalized accordingly. Y-axis: numbers of genes.
