Figure 3.

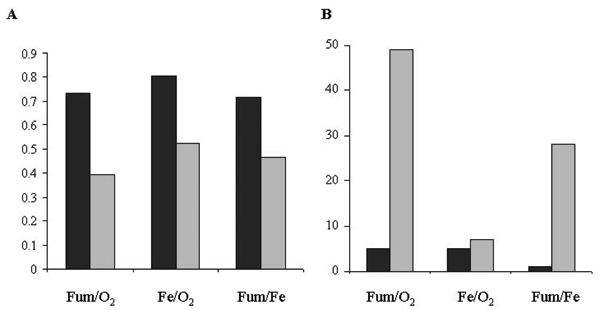
Assessment of logarithmic transformation. Black and gray columns represent proportional and additive models, respectively. (A) A histogram representing r values. (B) A histogram showing the number of genes in opposite categories.

Assessment of logarithmic transformation. Black and gray columns represent proportional and additive models, respectively. (A) A histogram representing r values. (B) A histogram showing the number of genes in opposite categories.