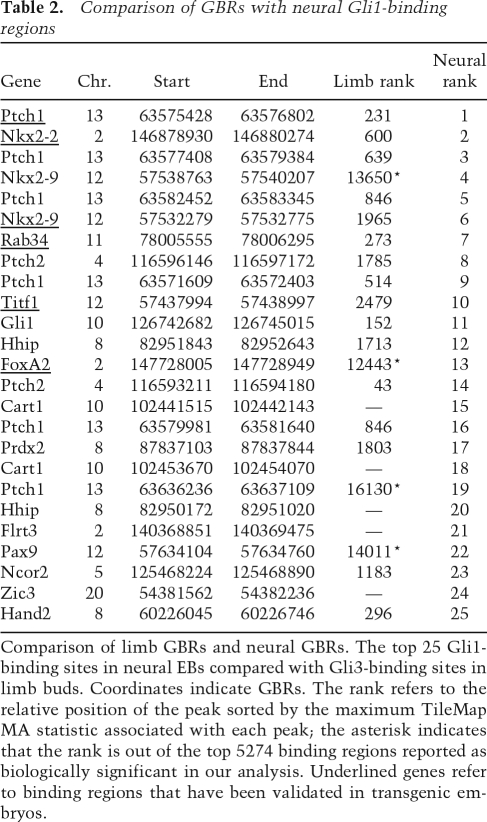
Table 2.
Comparison of GBRs with neural Gli1-binding regions
Comparison of limb GBRs and neural GBRs. The top 25 Gli1-binding sites in neural EBs compared with Gli3-binding sites in limb buds. Coordinates indicate GBRs. The rank refers to the relative position of the peak sorted by the maximum TileMap MA statistic associated with each peak; the asterisk indicates that the rank is out of the top 5274 binding regions reported as biologically significant in our analysis. Underlined genes refer to binding regions that have been validated in transgenic embryos.

