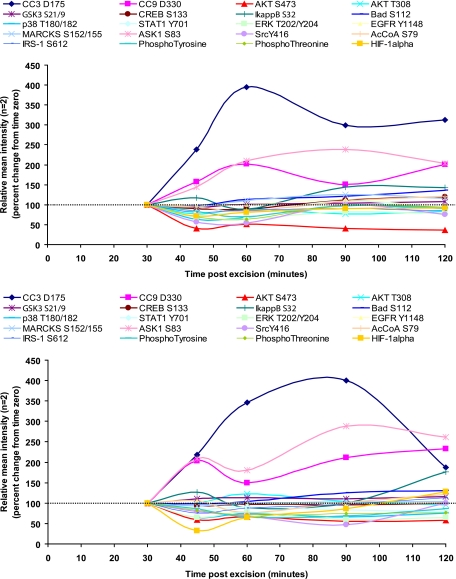
Fig. 7.
4 °C and room temperature time course. A, 4 °C time course for normal uterine tissue. B, room temperature time course for normal uterine tissue. Each analyte listed above the graph is displayed in a different color and symbol as designated. Increases and decreases in specific protein levels are noted over time compared with the initial (time 0) tissue aliquot that was frozen 30 min after excision (represented as 100%). Each time point represents an individual piece of tissue (mean of replicate array spots, n = 2). AcCoA, acetyl-CoA carboxylase.

