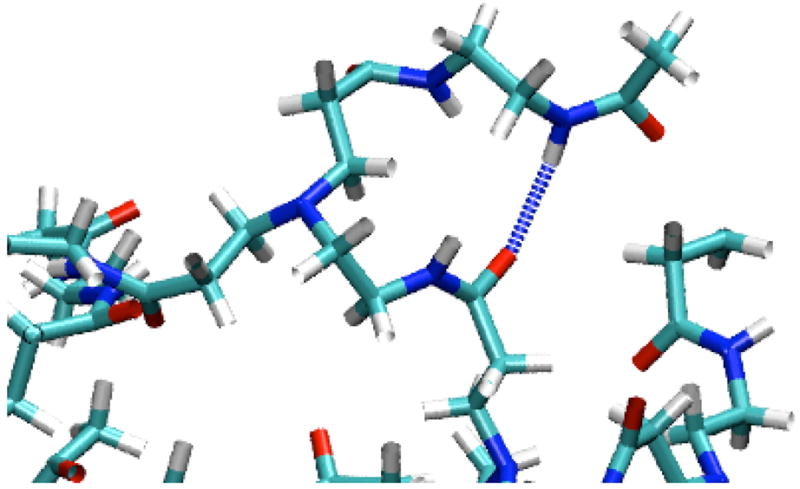
Figure 6.

Snapshot of the hydrogen bond interaction between an O atom of G4 and an NH atom of G5 in G5-Ac90. Light blue regions represent C atoms, dark blue represent N atoms, red regions represent O atoms, white regions represent H atoms, and a dotted line represents a hydrogen bond. The water molecules are omitted for clarity.
