Figure 1.
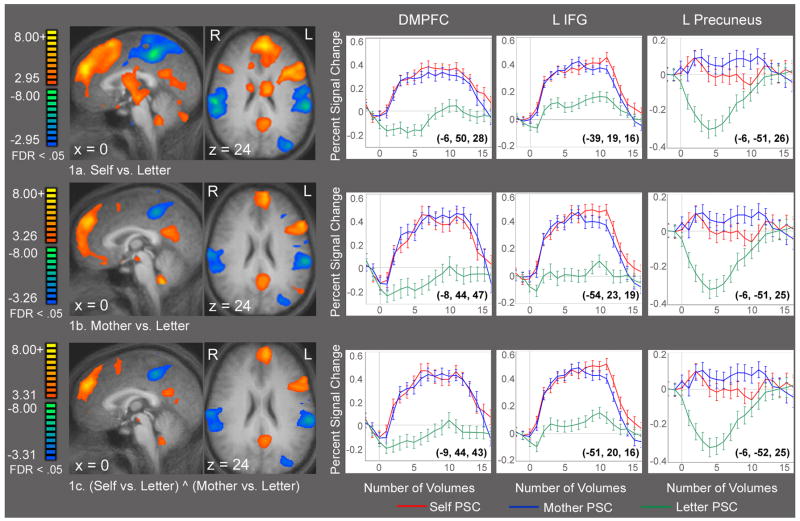
Figure 1a–c. Referential Processing. Composite t-maps displayed on averaged structural brain, n = 17. False discovery rate (FDR) of .05 was used for all comparisons in this figure. 1a–b. Statistical activation maps demonstrating recruitment of similar regions in the Self vs. Letter and Mother vs. Letter contrasts. 1c. Conjunction analysis (Self vs. Letter) ^ (Mother vs. Letter) demonstrating those brain regions that were activated in both Self and Mother conditions. Data shown in 1c combines data from 1a and 1b, but excludes regions that were only activated during either self- or mother-referential processing. Average time courses extracted from the dorsal medial prefrontal cortex, left inferior frontal gyrus and left precuneus regions are also provided for each contrast, showing percent signal change over volumes of time. Talairach coordinates of the peak voxel is in parentheses on each graph. See Table 2 for Talairach coordinates and t-values of the peak voxel for all significant activations of the conjunction analysis.

