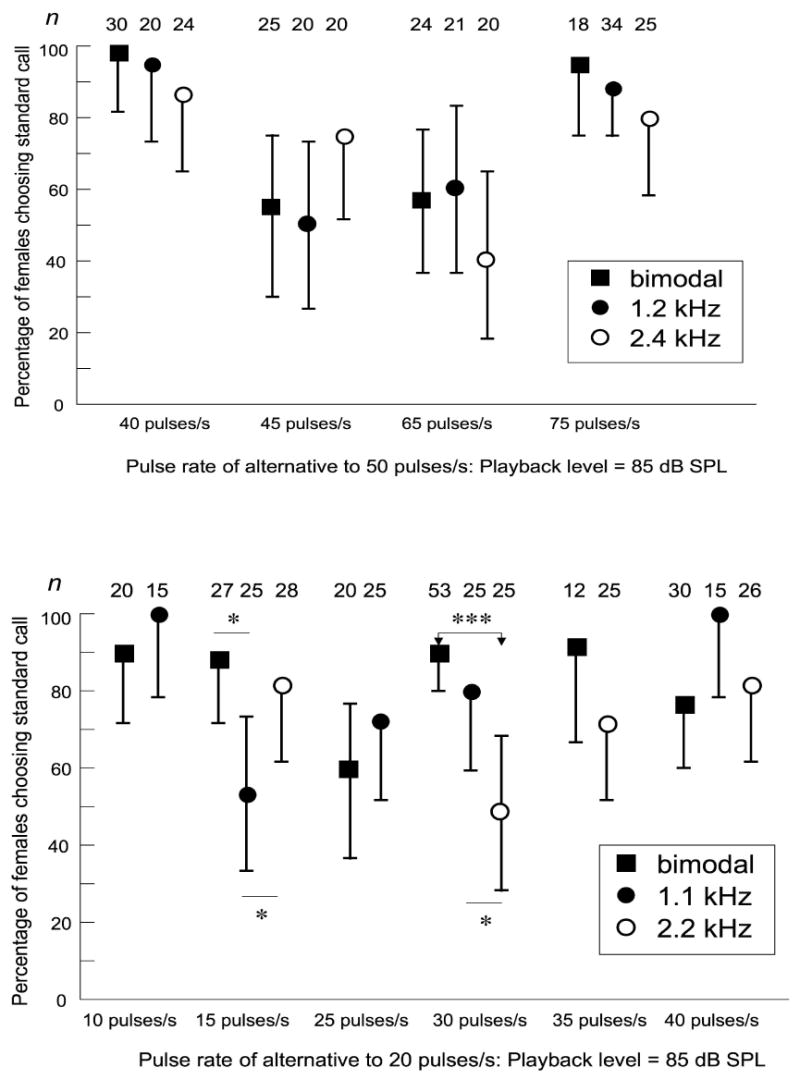
Figure 2.

Comparisons of pulse-rate preferences using different carrier frequencies at a playback level of 85 dB SPL. Data for bimodal spectra were previously published in Gerhardt (2005a) and are re-plotted here. (a) Preferences of females of H. chrysoscelis; (b) Preferences of females of H. versicolor. Error bars are 95% credible intervals, and statistically significant, post-hoc comparisons of least-square-means between the proportions of females choosing the standard call depending on carrier frequency are indicated by asterisks (* = p < 0.05; *** = p < 0.001). See Methods and Results for details about the statistical analyses. n = number of female choices (one per female in each test).
