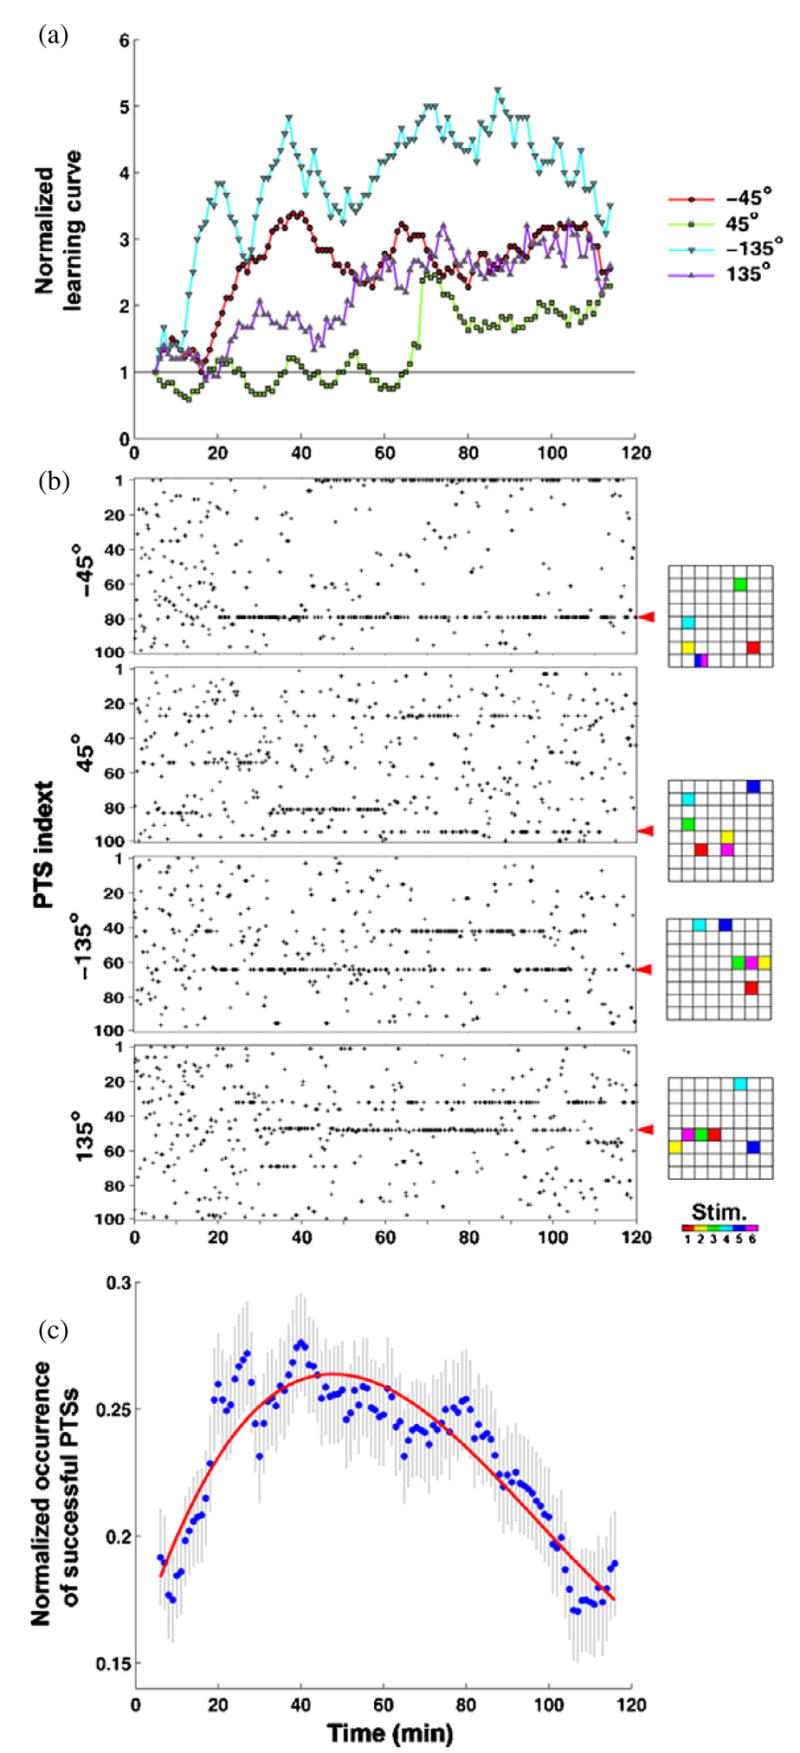
Figure 7.

Training required different PTSs at different times. (a) A normalized version of the learning curve shown in figure 2(c). (b) PTSs delivered for different desired directions are shown as black pluses. The corresponding probability in time is shown in figure 3 (031007 B). Various different PTSs were needed to induce appropriate neuronal plasticity and successful motor output. Electrode locations and order (right) for the PTSs (indicated by red arrows) are shown in 8 × 8 grids of electrode locations. (c) Across the 23 trials, fewer PTSs were needed in time to maintain a successful motor output. The frequency of occurrence of a successful PTS was measured by a 10 min moving time bin with 1 min time step and normalized by its maximum value (set to 1). A successful PTS was defined as one that improved performance at least one time. The initial rise occurred while appropriate PTSs were searched. PTS occurrence decreased over the last hour (Spearman correlation of means (dots), one-tailed, rho = −0.89, p-value < 1 × 10⁻⁵, n = 231 successful PTSs in 23 trials), which indicates that the training stimuli that were successful in the first hour were less often or no longer required during the last hour to maintain an increased rate of correct motor outputs. A cubic polynomial (red) was fit to the data to better visualize the trend.
