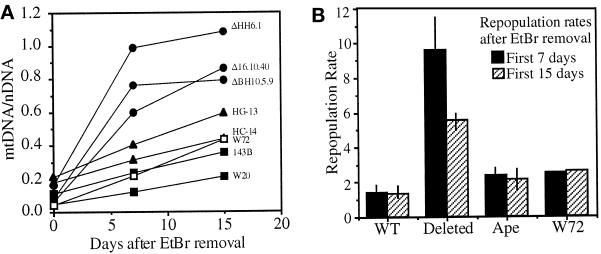
Figure 5.
mtDNA repopulation rates of various haplotypes. (A) Repopulation rates of the cell lines described in Figure 3 were compared. Cell lines harboring partially deleted mtDNA increased their mtDNA content rapidly during the first 7 d after EtBr removal, slowing down during the subsequent 8 d. (B) The mean linear repopulation rates of the combined cells harboring mtDNA deletions were significantly higher than the control cell lines during the first 7 d (gray bars) or 15 d (hatched bars). Ape mtDNA (chimpanzee and gorilla) linear repopulation rates were not significantly different from those of controls during the same repopulation period. The rate in cell line W72 was also not markedly different from that in cell lines containing wild-type or ape mtDNAs. Error bars represent the range of values for the different cell lines in each group.

