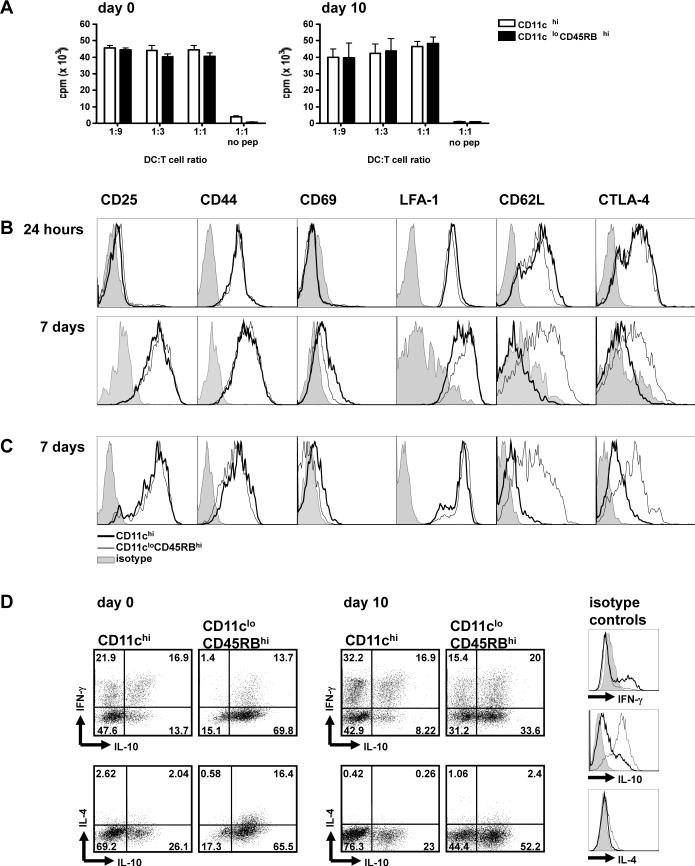
Figure 3. Regulatory CD11cloCD45RBhi DCs induce proliferation and IL-10 expression in antigen-specific CD4 T cells.
Mice were injected i.p. with 106 infected erythrocytes. At days 0 (naive mice) and 10 post-injection, DC subsets were sorted by FACS. DC subsets were then co-cultured with naive CD4 T cells isolated from DO11.10 mice in the presence of OVA peptide. (A) After 4 days of co-culture, T cell proliferation was determined using the incorporation of [H3]-thymidine for the final 16 hours of culture as a readout. Error bars represent standard deviation within co-cultures of cells sorted from 3 individual mice. (B-C) After 24 hours or 7 days of co-culture with DCs sorted from infected (B) or naive (C) mice, T cells were collected and assayed via flow cytometry for markers of T cell activation. FACS histograms show the expression of the surface marker when T cells are co-cultured with CD11chi DCs (thick line) or CD11cloCD45RBhi DCs (thin line). Stainings with isotype control antibodies are shown in the grey shaded histograms. Each FACS plot is representative of one out of three individual mice. (D) After 7 days of co-culture with sorted DCs from day 0 (naïve) or day 10-infected mice, cells were restimulated with PMA and ionomycin for 5 hours. CD4 T cells were stained intracellularly for cytokine expression. Isotype controls for the cytokine-specific antibodies are shown as FACS histograms, as detailed in B. Each FACS plot is representative of one out of three DC-T cell co-cultures, and are representative of two independent experiments.

