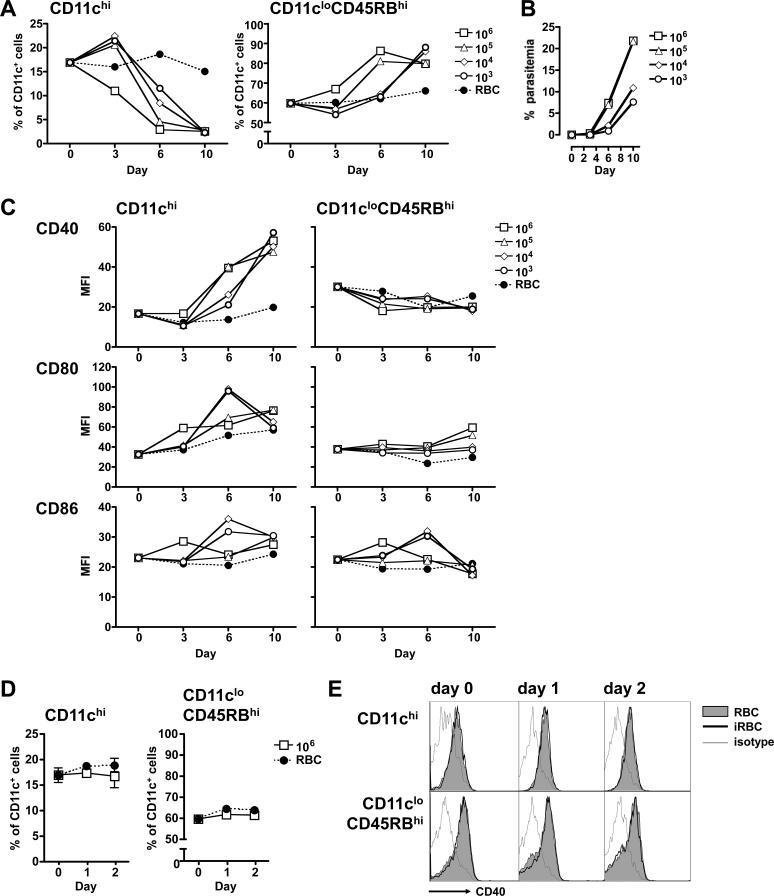
Figure 5. The dose of infected erythrocytes dictates the balance of DC subsets observed during an acute P. yoelii infection.
(A-C) Mice were injected i.p. with 106 control (RBC, black circles) or 106, 105, 104, or 103 infected (white symbols) erythrocytes. (A) At the indicated days post-injection, splenocytes from groups of 3 mice were analyzed for the two subpopulations, expressed as the proportion of CD11c+ cells (DCs). (B) Parasitaemia were quantified by Giemsa-stained slides. (C) The expression of costimulatory molecules for the splenic DC subsets from (A), expressed as mean fluorescence intensity (MFI). The results are representative of two similar independent experiments. (D-E) Mice were injected i.p. with 106 control or infected erythrocytes. At days 0, 1 or 2 post-injection, splenocytes from groups of 3 mice were analyzed for the two subpopulations. (D) Subpopulations from control (RBC, black circles) or infected (iRBC, white squares) mice are expressed as the proportion of CD11c+ cells (DCs). Error bars represent standard deviation within groups of at least 3 mice (no significant difference when comparing iRBC to RBC by two-way ANOVA). (E) FACS plots showing expression of CD40 on DCs from control (grey shaded histogram) and infected (empty histogram with heavy line) mice. An isotype-matched control was also analyzed (thin grey line).

