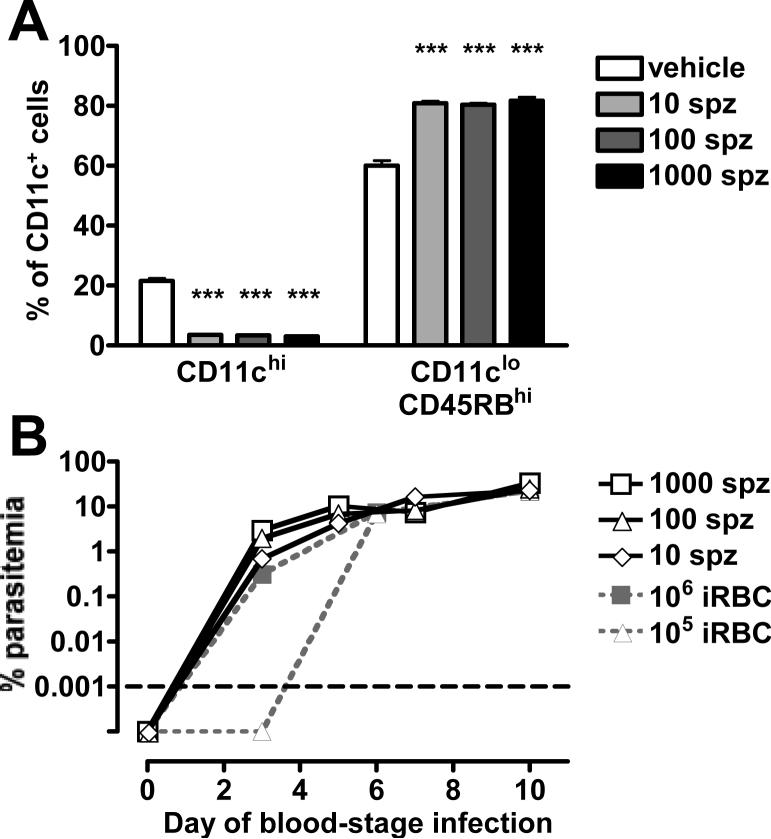
Figure 6. Blood-stage infections started sporozoites are similar to those started with 106 infected erythrocytes.
Mice were injected i.v. with 1000, 100 or 10 sporozoites (spz, black and grey bars) or the vehicle RPMI (white bars). (A) At the indicated days post-injection, splenocytes from groups of 3 mice were analyzed for the two subpopulations, expressed as the proportion of CD11c+ cells (DCs). Error bars represent standard deviation within groups of 3 mice (***, P < 0.001 when comparing iRBC to RBC by one-way ANOVA). (B) Parasitaemia were counted via Giemsa-stained slides (white symbols) and are overlaid here with the parasitemia curves from infections started with 106 and 105 infected erythrocytes from Figure 5B for comparison (grey symbols). The differences between the doses of 106 and 105 infected erythrocytes on day 3 become apparent because of the logarithmic scale used. The graph is normalized to account for the 2 days of development required by sporozoites before starting blood-stage infections. Parasitemia counts below the level of detection are plotted below the black dashed line.

