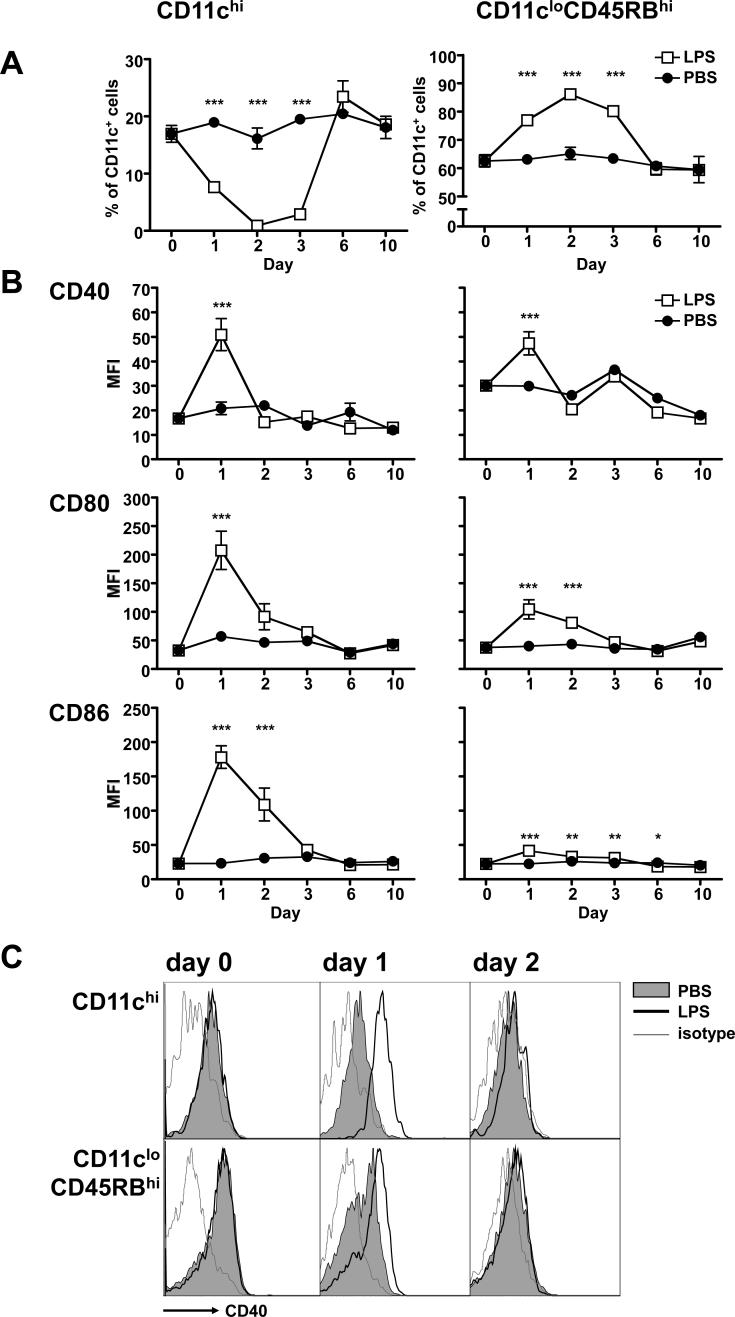
Figure 7. A sublethal dose of LPS induces expansion of regulatory CD11cloCD45RBhi DCs.
Mice were injected i.v. with 15μg LPS (white squares) or vehicle (PBS, black circles). (A) At the indicated days post-injection, splenocytes from groups of 3 mice were analyzed for the two subpopulations, expressed as the proportion of CD11c+ cells (DCs). (B) Each subset was also assayed for expression of costimulatory molecules, expressed as mean fluorescence intensity (MFI). Error bars represent standard deviation within groups of at least 3 mice (*, P < 0.05; ***, P < 0.001 when comparing LPS to PBS by two-way ANOVA). (C) FACS plots showing expression of CD40 on DCs from mice that had received vehicle (grey shaded histogram) or LPS (empty histogram with heavy line). An isotype-matched control was also analyzed (thin grey line).

