
Figure 2. Experimental design and device capabilities.
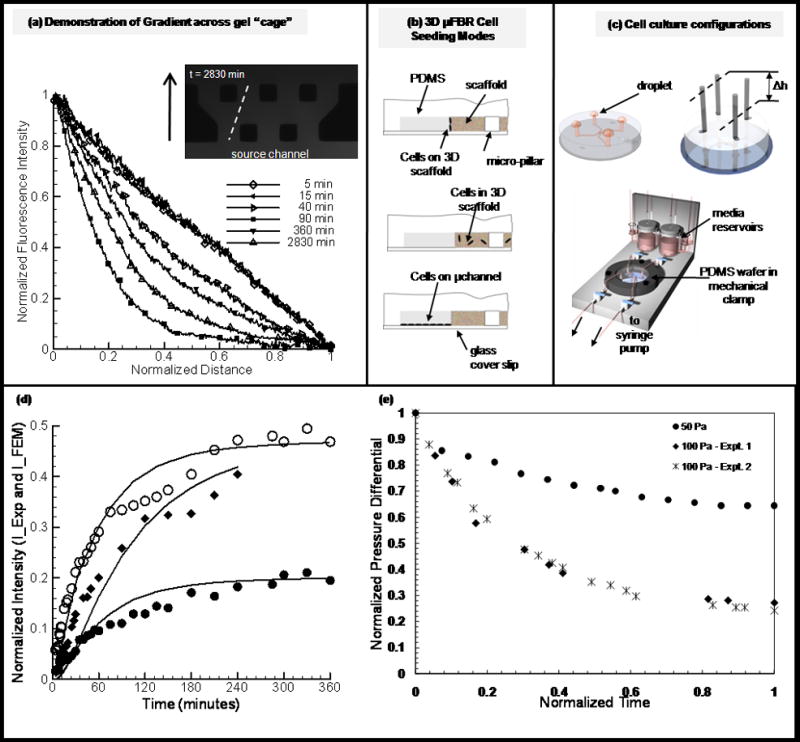
(a) Demonstration of gradient across gel “cage”. Collagen gels were formed as described in Methods and Materials. Fluorescent dextran (40kDa) was used to demonstrate the capability of generation gradients in the μFD. Shown are the time-course of fluorescent intensity and concentration of dextran (used to simulate nonreactive solute within that size range) across the gel “cage”. Plot (a) shows representative experimental curves plotted for over 40 hours. (b) Schematic of cell culture assays. (top) EC sprouting assay. Cells are cultured on a 3-dimensional gel with physiological relevant polarity. (middle) 3D encapsulation assay. Cells are suspended in the gel and are initially separated from each other. (bottom) 2D migration assay. Cells form monolayer predominantly on glass substrate (non-compliant) coated with ECM material (fibronectin) (d) Cell culture flow configurations. (1) For static cultures droplets of media are place on inlet and outlet ports. Devices are kept in local high humidity (Petri dish with water) secondary container in the incubator. (2) Setup used for imposing pressure gradient across gel cage, differential in height of liquid reservoirs. (3) Microfluidic platform. Schematic of platform used for generating physiological levels of shear stress in micro channels. (d) Plots represent values of normalized intensity at fix locations in the gel region, solid lines are theoretical predictions and shape-markers (circles (open-middle, solid-near sink channel) and squares for devices D and C respectively (supplementary table 1) are for experimental results (detailed in supplementary materials). (e) Experimental results for the evolution of normalized pressure differential (dP/dPmax) for generating interstitial flow through three-dimensional scaffold in DFD (detailed in supplementary materials), values in Pa indicate initial pressure differential.