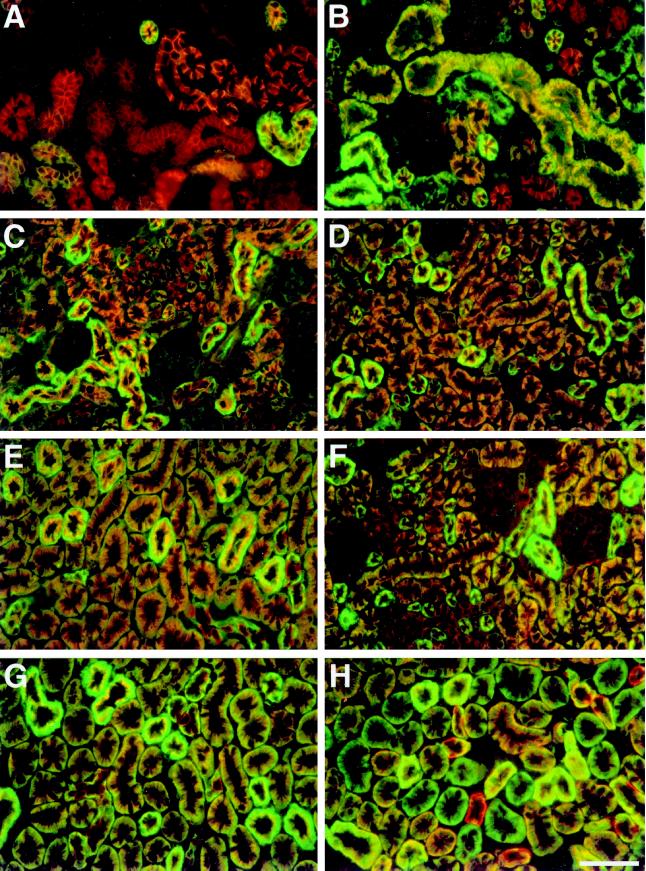
Figure 4.
Relative staining intensities of Na/K-ATPase, membrane cytoskeleton, and E-cadherin along developing nephrons. Kidney sections from E16, neonatal, and 1-, 2-, and 4-wk-old CD1 mice were subjected to double immunofluorescence with polyclonal antibodies to ankyrin-3, fodrin, and E-cadherin and a monoclonal antibody to Na/K-ATPase. (A–E) fields from E16, neonatal, and 1-, 2-, and 4-wk-old kidneys, respectively, which were subjected to double immunofluorescence with antibodies to ankyrin-3 and Na/K-ATPase. Ankyrin-3 was detected using rhodamine-labeled secondary antibody, and Na/K-ATPase was detected using fluorescein-labeled secondary antibody. (F, G) Fields from 2- and 4-wk-old kidneys, respectively, that were subjected to double immunofluorescence with antibodies against fodrin and Na/K-ATPase. Fodrin was detected using rhodamine-labeled secondary antibody, and Na/K-ATPase was detected using fluorescein-labeled secondary antibody. (H) Field from 4-wk-old kidney that was subjected to double immunofluorescence with antibodies to E-cadherin and Na/K-ATPase. E-cadherin was detected with rhodamine-labeled secondary antibody, and Na/K-ATPase was detected using fluorescein-labeled secondary antibody. All fields are shown at the same magnification. Bar, 50 μm.

