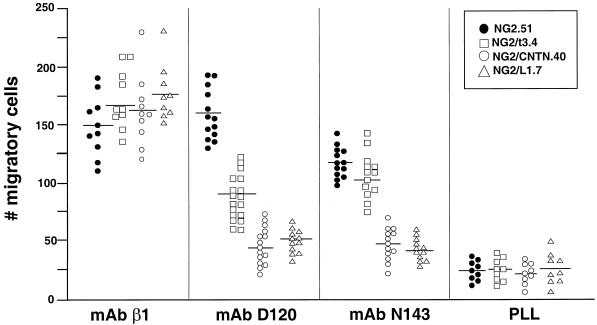
Figure 6.
Quantitation of migration of U251 transfectants. Experiments similar to those shown in Figure 5 were conducted using two independent U251 clones of the following cell types: wild type (U251NG2.51 and U251NG2.35), NG2/t3 mutant (U251NG2/t3.4 and U251NG2/t3.18), NG2/CNTN chimera (U251NG2/CNTN.40 and U251NG2/CNTN.10), and NG2/L1 chimera (U251NG2/L1.7 and U251NG2/L1.3). Experiments were carried out for 24 h rather than 16 h (as in Figure 5) to obtain larger numbers of migratory cells for counting. The distribution of data points is shown for only one of the two clones of each cell type, but the behavior of the two clones was extremely similar in all cases (not significantly different from each other). Horizontal lines show the mean value for migration in each set of points. Statistical analysis of the data by a nonpaired t test showed that, on mAb D120–coated surfaces, the migration of the NG2/t3-transfected cells was significantly different from the migration of both wild-type NG2 transfectants and chimeric transfectants (p < 0.0001). On mAb N143–coated surfaces, the migration of both NG2 and NG2/t3 transfectants was significantly different from the migration of the chimeric transfectants (p < 0.0001), but the behavior of NG2- and NG2/t3-expressing cells could not be statistically distinguished.

