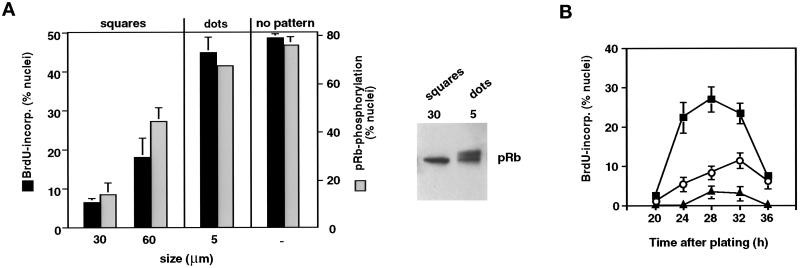
Figure 4.
Cell shape–dependent control of passage through the G1/S transition. (A) Left, effects of varying FN substrate geometry on S phase entry (cumulative nuclear incorporation of BrdU at 30 h; black bars) and pRb hyperphosphorylation (negative pRb staining nuclei after treatment with nuclear extraction buffer at 18 h; gray bars) in synchronized CE cells, determined as in Figure 2A. Size indicates width of square islands and diameter of circular dotlike islands; no pattern indicates an unpatterned surface of identical chemistry. Right, for the 30-μm squares and the 5-μm dots, pRb phosphorylation status was confirmed by Western blot analysis as in Figure 2. (B) Kinetics of S phase entry in synchronized CE cells on unpatterned substrata (▪) or circular adhesive islands with diameters of 50 (○) or 20 μm (▴), measured as in Figure 2D.

