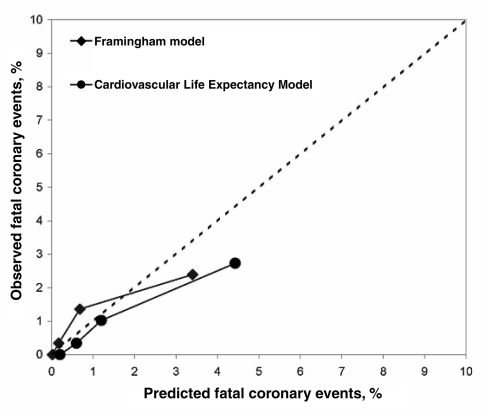
Figure 3.
Calibration of the Framingham model and the Cardiovascular Life Expectancy Model. Each model was used to estimate the risk of each Canadian subject in the Lipid Research Clinics Follow-Up Cohort, and all subjects were then rank-ordered from the lowest to highest risk. Dividing the cohort into risk quartiles, the mean risk estimated for each quartile was compared with the coronary death rate actually observed

