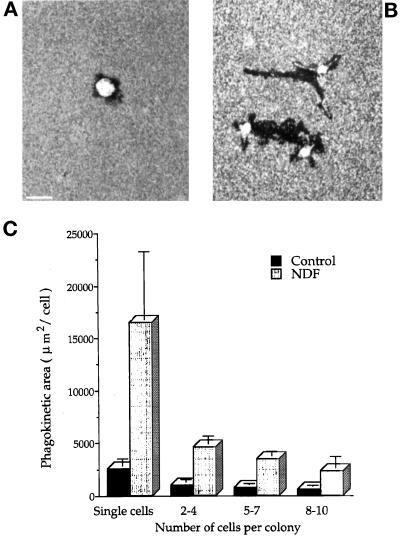
Figure 4.
Neuregulin increases cell motility. The trajectories of control (A) and neuregulin-stimulated (20 ng/ml) (B) cells visualized by the phagokinetic track method are shown. The areas of the phagokinetic tracks formed by single cells and small cell colonies, normalized to the number of cells, are shown in C. Results of one typical experiment are presented; 50 tracks were measured for each experimental point. Two other experiments showed a similar effect. Bar (A and B), 100 μm.

