
FIGURE 2.
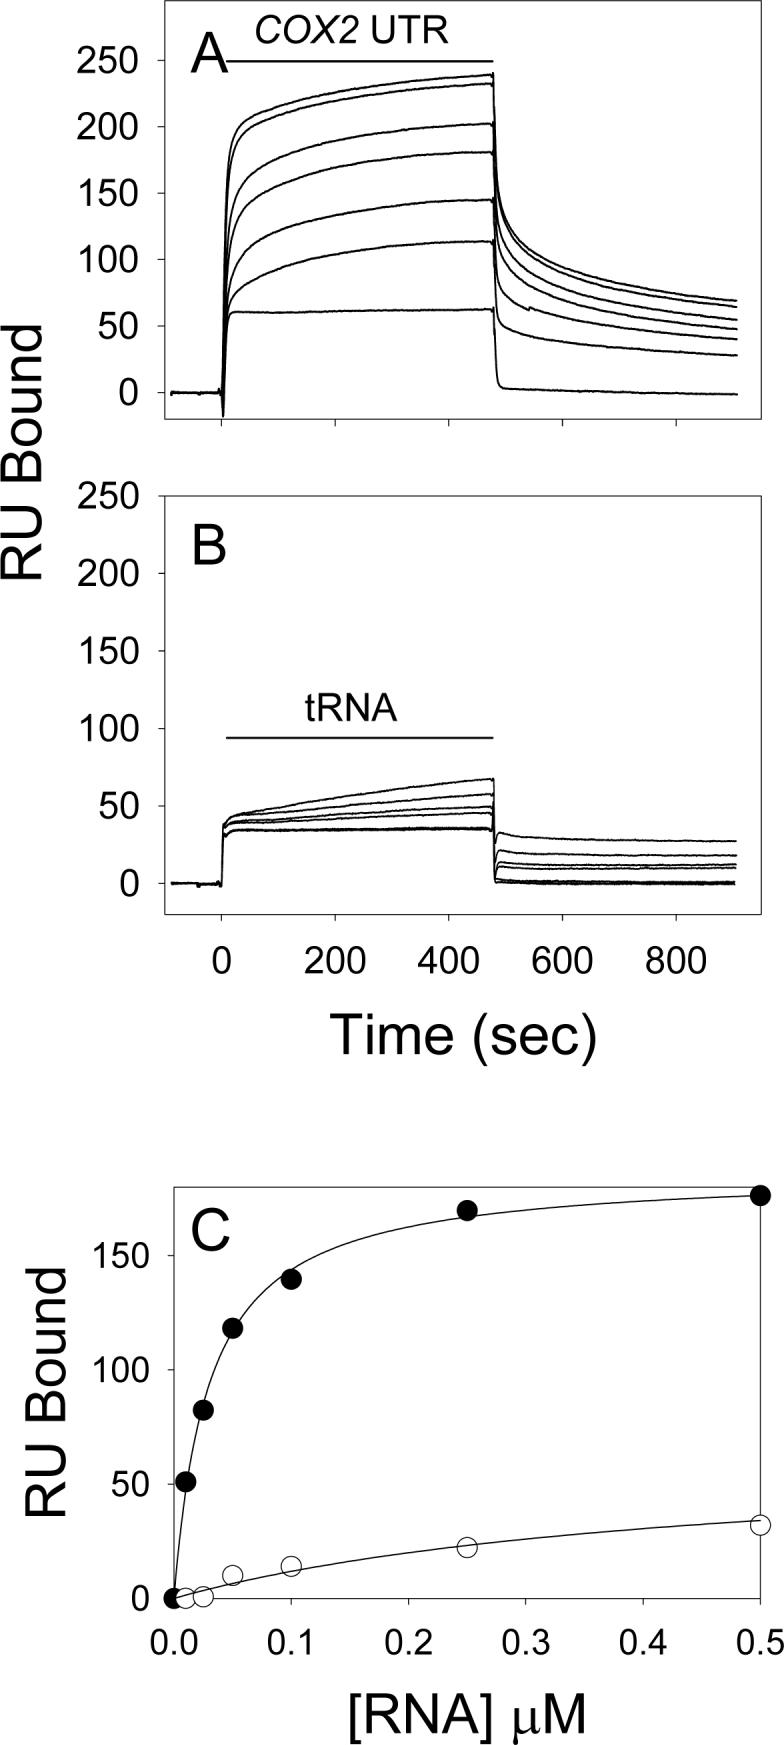
SPR analysis of the interactions of IDH with RNAs. Interactions of wild-type IDH coupled to sensor chips with buffer concentrations of COX2 mRNA UTR (A) or of yeast tRNA (B) ranging from 0 μM to 0.5 μM were analyzed using SPR. Runs in A were conducted in the presence of 2 mM DL-isocitrate and 50 μM AMP. Times of RNA injections are indicated by bars. The lowest trace in each experiment was recorded in the absence of RNA and reflects differences in refractive index caused by introducing buffer alone. This response was subtracted from responses recorded in the presence of RNA, and the maximal response at the stop of each injection was plotted (C) as a function of the concentration of COX2 UTR RNA (•) or of tRNA (○). The data were fit to rectangular hyperbolic equations, and the concentration of COX2 mRNA producing half maximal binding was taken as the apparent Kd.