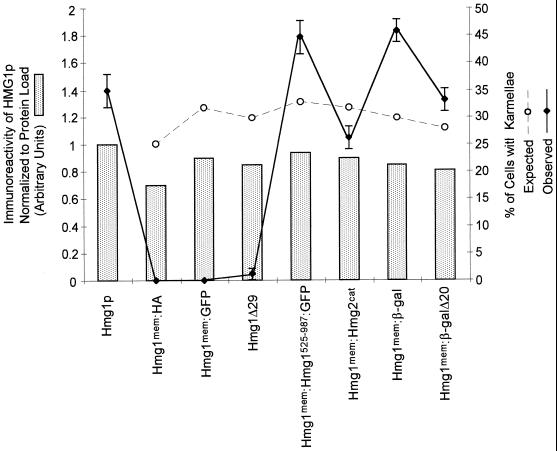
Figure 3.
Comparison of relative protein levels and ability to induce karmellae for the Hmg1 fusion proteins. The graph compares the relative protein levels of the Hmg1 fusion proteins with the wild-type Hmg1p level. The wild-type Hmg1p steady-state level was set to 1.0. For each strain, the percentage of cells in the population with karmellae was observed using DiOC6, which stains the ER. The expected percentage of cells with karmellae was determined by adjusting the observed percentage of karmellae in the wild-type Hmg1p strain for the relative HMG-CoA reductase protein level in each subsequent strain.

