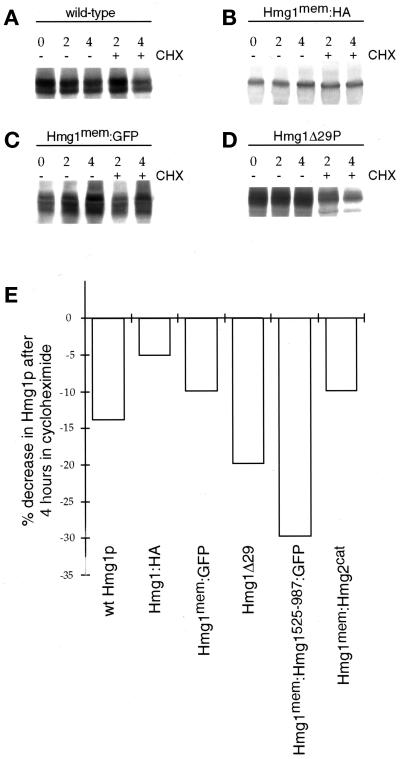
Figure 4.
Comparison of Hmg1p levels in wild-type cells and cells expressing the Hmg1 fusion proteins. Total cellular membranes were isolated and prepared for immunoblotting. At time zero, the culture was split into two flasks with one flask receiving CHX. At subsequent times (2 and 4 h), aliquots were removed for membrane isolation. (A) Intact Hmg1p (RWY 410) was detected using an antisera against the Hmg1p catalytic domain. (B) The truncated Hmg1mem:HA protein (RWY 614) was detected using the 12CA5 anti-HA antibody. (C) The Hmg1mem:GFP fusion (RWY 626) was detected using anti-GFP antisera. (D) Hmg1Δ29p (RWY 406) was detected using an antisera against the Hmg1p catalytic domain. (E) The graph compared the fusion protein levels, normalized to total protein and to designation of the zero time point level for each protein set to 1.0. The relative levels of protein were determined for all time points, and the percent decrease was calculated by comparing the 0-h protein level with the 4-h with-CHX protein level.

