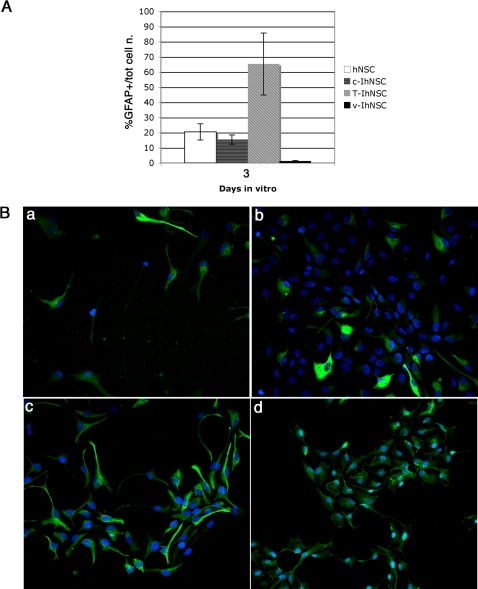
Figure 4. Analysis of precocious GFAP expression in T58A differentiating cells.
A) Quantitative analysis of expression of the astroglial marker GFAP in progenitor cells (3 days in FGF2) from hNSC, c-IhNSC, T-IhNSC, and v-IhNSC cells. Data are expressed as percentages of GFAP+ cells of the total number of cells. B) Immunofluorescence staining of hNSC (a), c-IhNSC (b), T-IhNSC (c), and v-IhNSC (d) cells at 3 days in vitro for GFAP. DAPI nuclear staining (blue) is also shown to detect total cell number. Magnification 20×.

