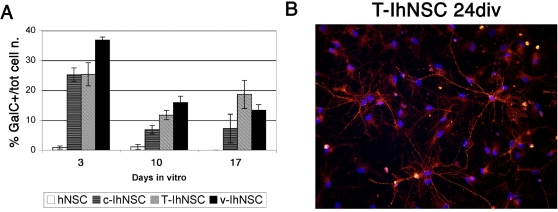
Figure 6. Morphological differentiation of premyelinating oligodendrocytes in differentiated T-IhNSC cells.
A) Quantitative analysis of the expression of the oligodendroglial markers GalC. Data are expressed as percentages of positive cells over total number of cells at 3, 10, 17 days of differentiation. B) Exemplar oligodendrocytes obtained by T-IhNSC cells differentiation at 24 days in vitro. The oligodendroglial cells were labelled with GalC. DAPI nuclear staining (blue) is also shown. Magnification 40×.

