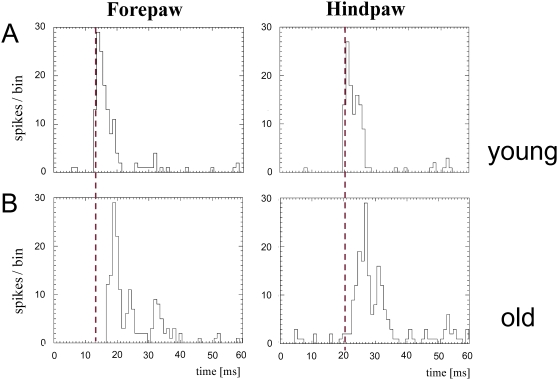
Figure 8. Response latencies of cortical neurons recorded in the fore- and hindpaw map.
Examples of neuronal responses in form of post-stimulus time histograms (PSTHs) after tactile stimulation applied to the center of a RF. The number of spikes/bin (binwidth = 1 ms) is plotted against time. The red dotted line marks the time of maximal cell response (peak latency) in the PSTHs of fore- (left) and hindpaw (right) neurons of the young animal (upper panel). (A) Examples of PSTHs recorded in the fore- (left) and in the hindpaw representation (right) of a young rat (5 months). (B) Examples of PSTHs recorded in the fore- (left) and in the hindpaw representation (right) of an old rat (29 months). Response latencies were lengthened in aged animals by approximately the same amount for neurons of both representations.

