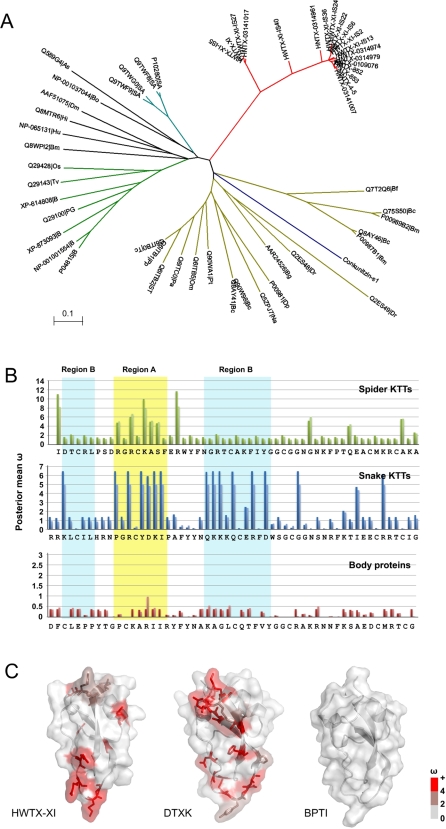
Figure 9. Phylogenetic tree of the KTTs and nonsynonymous/synonymous mutation ratios (ω) comparison.
(A), A minimum evolution (ME) tree of mature fragments of KTTs and some Kunitz type body proteins in various taxon groups. The branches are coloured as follows: red, spider KTTs; cyan, sea anemone; green, BPTI homologies from mammals; dark yellow, snake KTTs; blue, conkunitzin from cone snail; black, others. (B), Column charts of the posterior mean nonsynonymous/synonymous mutation ratios (ω) for each site in spider, snake KTTs as well as body Kunitz proteins. In these charts, the deep colour column is based on Model 3 (discrete) and the light one is based on Model 8 (beta&ω>1). Region A and B are marked by yellow and cyan backgrounds, and the secondary structure of HWTX-XI is shown on the bottom. (C), Surface models of representative spider KTTs (HWTX-XI), snake KTTs (DTXK) and Body proteins (BPTI). The residues are colored based on the value of ω in Model 8.

