
Fig 1.
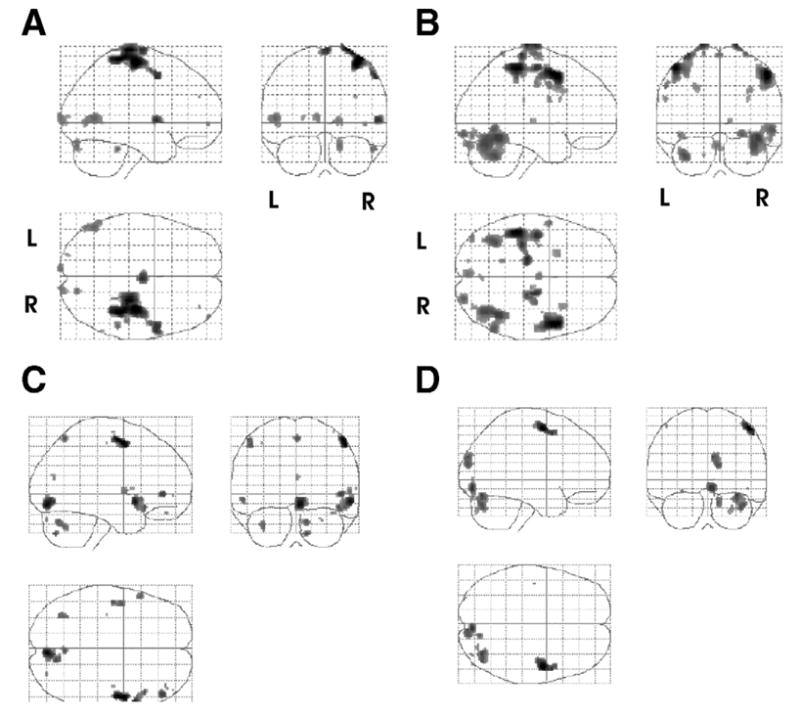
Brain activity associated with CIMT only. Activation maps are shown as a through-projection onto a lateral, sagittal, and horizontal representation of standard stereotactic space. Images reflecting the activations in 4 subtractions. The top row of images depicts the sites of activation by subtracting the rest condition from the actual movement of the left hand condition (A) pretreatment (move affected > rest) and (B) posttreatment (move affected > rest). Note (B) increased bilateral cortical activation following treatment. The second row depicts the sites from the subtraction of the rest from imagine moving the left hand condition both (C) pretreatment (imagine move affected > rest) and (D) posttreatment (imagine move affected > rest). Shown are all activations that passed a criterion of P <.05 corrected for multiple comparisons with an extent threshold of 0. Abbreviations: L, left; R, right.