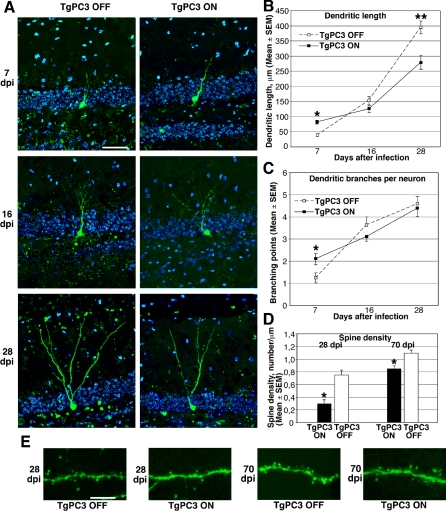
Figure 2. Morphological Analysis of the Development of Adult-Generated Dentate Gyrus Neurons.
(A) Representative morphology of adult-generated neurons labeled with GFP by retrovirus-mediated gene transduction, analyzed from 7–28 dpi, in control (TgPC3 OFF) or activated transgenic mice (TgPC3 ON; the transgene was activated 60 d before infection, according to the time schedule of Figure 1). The GFP+ neurons (green) are localized at the hilar border of the dentate gyrus, whose cells are identified by Hoechst 33258 staining (blue). The molecular layer is localized at the upper side of the images. Scale bar, 50 μm.
(B) Quantification of the dendritic length of adult-generated GFP+ neurons at 7, 16, and 28 dpi. (F(5, 148) = 73.7; p < 0.0001, ANOVA. *p < 0.05 or **p < 0.001 between TgPC3 ON and OFF groups at the same day post infection, ANOVA Fisher's PLSD post-hoc analysis).
(C) Quantification of branching points at 7, 16, and 28 dpi. (F(5, 148) = 19.8; p < 0.0001, ANOVA. *p < 0.05 between 7 dpi TgPC3 ON and OFF groups, ANOVA Fisher's PLSD post-hoc analysis).
(D) Quantification of spine density in the dendritic processes of GFP+ neurons analyzed at 28 dpi and 70 dpi. *p < 0.002, Student's t-test. Data in (B–D) are presented as mean ± SEM; at least three animals per group were analyzed.
(E) Representative confocal images of dendrites and spines in 28 dpi and 70 dpi GFP+ dentate gyrus neurons. Scale bar, 12 μm.

