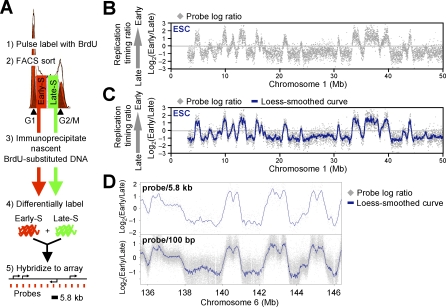
Figure 1. Genome-Wide Analysis of Replication Timing in mESCs.
(A) Protocol for genome-wide replication timing analysis using oligonucleotide microarrays with one probe every 5.8 kb.
(B and C) Generating replication-timing profiles. An exemplary mESC replication-timing profile of a Chromosome 1 segment is shown. Raw values for probe log ratios [i.e., log2(Early/Late)] along the chromosome revealed a clear demarcation between regions of coordinate replication (B), which is highlighted upon overlaying a local polynomial smoothing (loess) curve (C).
(D) Analyses at a density of one probe per 5.8 kb or 100 bp show essentially identical smoothed replication-timing profiles.

