Fig. 5.

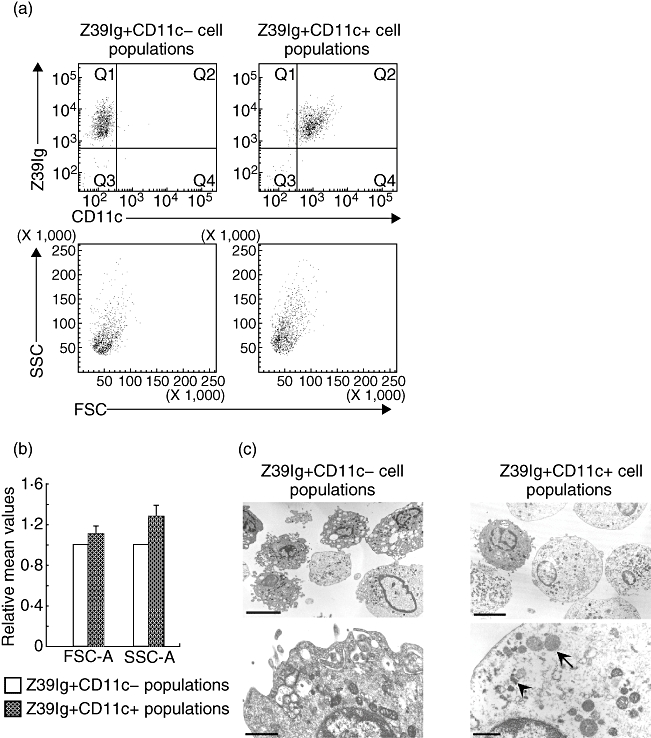
Analysis of Z39Ig+CD11c− and Z39Ig+CD11c+cells from RA synovial mononuclear cells. (a) RA synovial mononuclear cells were stained for Z39Ig+CD11c− cells and Z39Ig+CD11c+ cells, and analysed by the flow cytometry. Upper left and right panels show the analysis of sorted Z39Ig+CD11c− and Z39Ig+CD11c+ cell populations respectively. Lower left and right panels show two-dimensional dotplots showing FSC and SSC characteristics, corresponding to upper left and right panels respectively. The data are representative of independent experiments from five different RA synovial mononuclear cells. (b) The figure shows values of forward scatter-area (FSC-A) and side scatter-area (SSC-A) of Z39Ig+CD11c− or Z39Ig+CD11c+ cell populations from five different RA synovial mononuclear cells. Values of FSC-A and SSC-A of Z39Ig+CD11c− cells were arbitrarily set at 1·0 and relative values of FSC-A and SSC-A of Z39Ig+CD11c+cells to those of Z39Ig+CD11c−cells were presented as the mean ± SD. (c) Representative electron microscopic images of sorted cells in independent electron microscopic analysis from five different RA synovial mononuclear cells. *Cells in upper left and right panels were magnified in lower left and right panels respectively. Arrows and arrowheads indicate swollen mitochondrias and lysosomes respectively. Bars represent 6 µm in upper panels and 1 µm in lower panels.
