
Fig. 3.
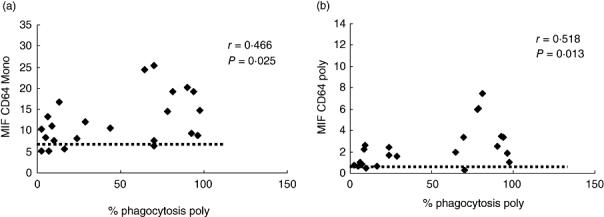
Correlation between phagocytic activity of PMNs and expression of CD64 on monocytes (a) and PMN (b) on the day of admission. Variables were evaluated by Pearson's correlation coefficient value. The horizontal dotted line represents the mean percentages of expression of CD64 on monocytes and PMN in the control group respectively.