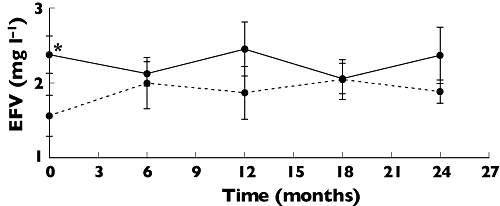
Figure 1.

Time course of plasma concentrations of efavirenz. The solid line represents plasma concentrations of HIV mono-infected patients (n = 18) and the dotted line refers to plasma concentrations in HIV patients co-infected with HBV or HCV (n = 9). Month 0 corresponds to the inclusion of the patients in the study. Each point represents mean ± SEM. *p < 0.05 Student's t-test
