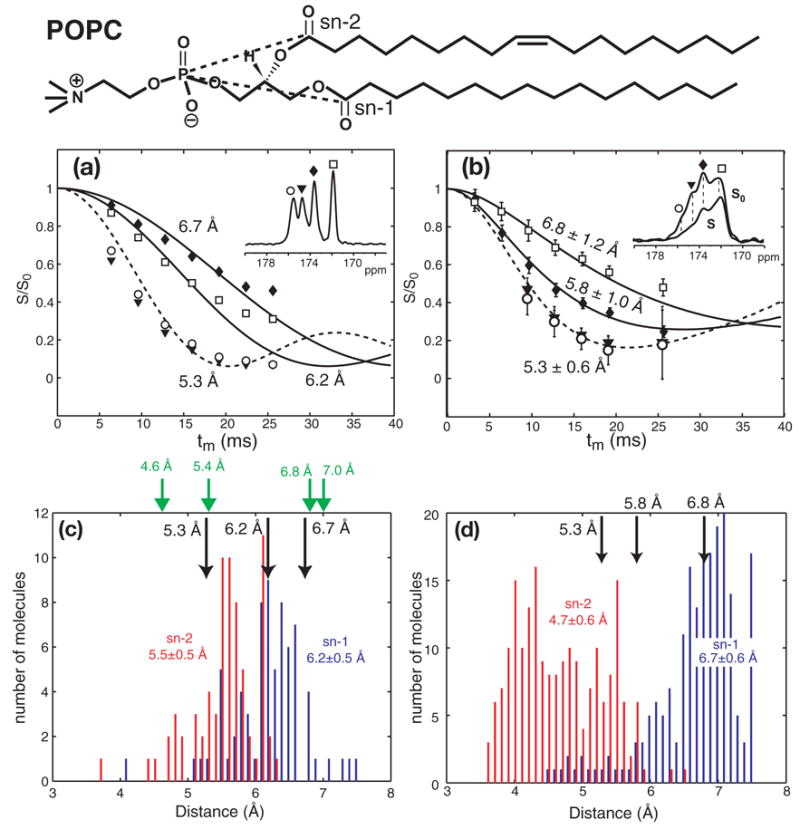
Fig. 3.

13C’{31P} REDOR data of (a) crystalline POPC at 293 K and (b) TRE-POPC at 263 K. The chemical structure of POPC is shown at the top, with the dashed lines indicating the distances measured here. (a) Best-fit distances for crystalline POPC, whose 13C’ spectrum is shown in the inset, are 5.3 Å (dashed line) for the two downfield peaks, and 6.2 Å and 6.7 Å (solid lines) for the two upfield peaks. (b) Inset is the S0 (solid line) and S (dashed line) spectra of TRE-POPC at tm = 12.8 ms. Best-fit distances are 5.3 ± 0.6 Å for the downfield peaks and 5.8 ± 1.0 Å and 6.8 ± 1.2 Å for the upfield peaks. Simulations in (a, b) used an intensity scaling factor of 90% to account for the effects of pulse imperfection [15]. (c) 13C’-31P distance distribution in liquid-crystalline POPC bilayers from MD simulations. The average sn-1 13C’ - 31P distance (blue) is 6.2 Å with a standard deviation of 0.5 Å. The average sn-2 13C’-31P distance (red) is 5.5 ± 0.5 Å. Black arrows: REDOR-extracted 13C’-31P distances in crystalline POPC. Green arrows: 13C’-31P distances in the DMPC crystal structure [11]. (d) 13C’-31P distance distribution in gel-phase POPC bilayers from MD simulations [12]. The average sn-1 13C’-31P distance (blue) is 6.7 ± 0.6 Å. The average sn-2 13C’-31P distance (red bars) is 4.7 ± 0.6 Å. Black arrows: measured 13C’-31P distances in the TRE-POPC membrane.
