
Figure 2.
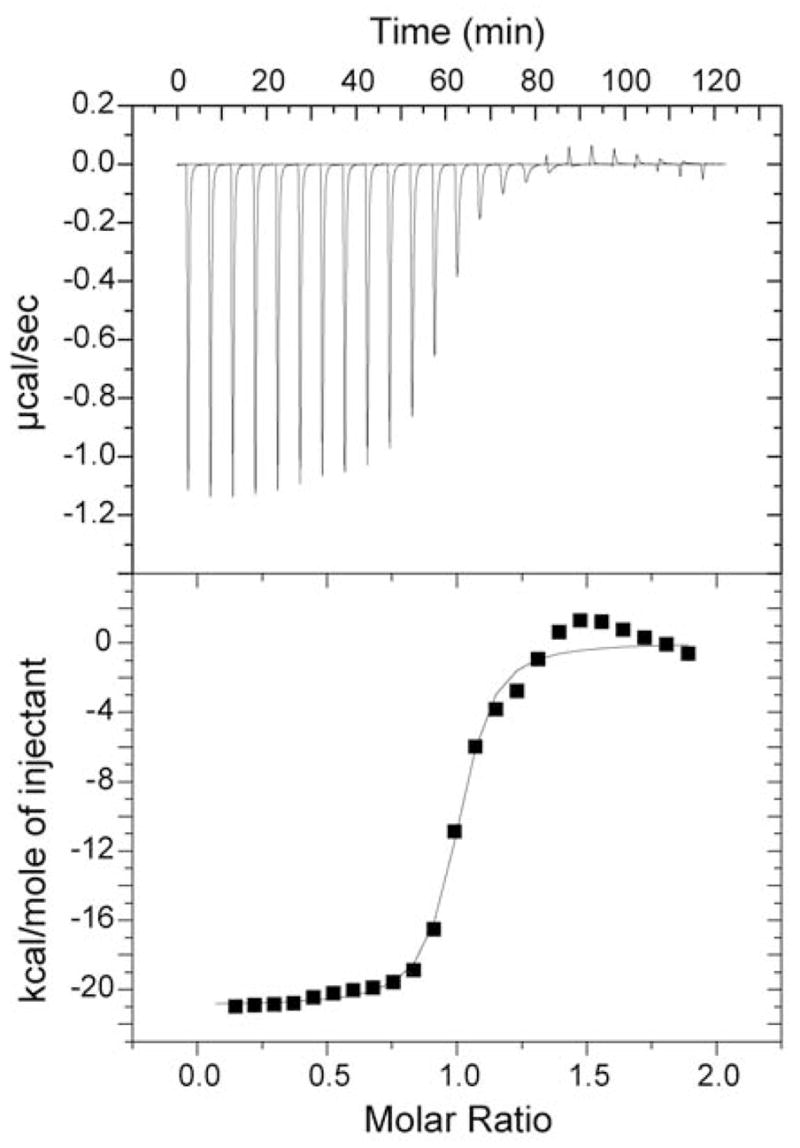
Binding isotherm for titrating CaM into CaMKKαp. Panel A shows the raw heats of titration of CaM into a dilute solution of CaMMαp. Panel B shows the best fit of integrated data to the single binding site model. Best fit values of KD, ΔH (and –TΔS) are given in the text.