
Figure 4.
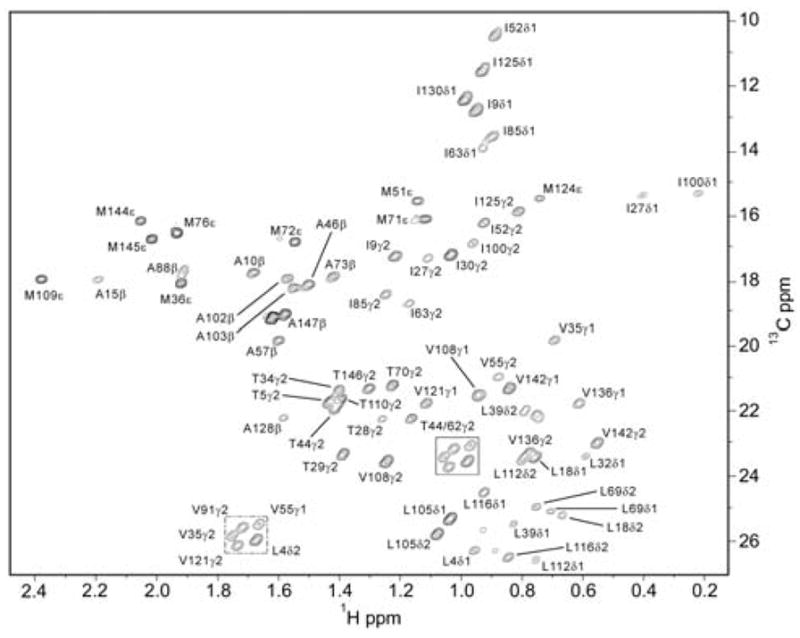
The 1H-13C HSQC spectrum of the CaM:CaMKKap complex. Shown is a contour plot of first time point (7ms) from the IzCzDz experiment acquired at 750 MHz. Seventy-one of 78 methyl groups in calmodulin were adequately resolved for analysis.
Official websites use .gov
A
.gov website belongs to an official
government organization in the United States.
Secure .gov websites use HTTPS
A lock (
) or https:// means you've safely
connected to the .gov website. Share sensitive
information only on official, secure websites.
The 1H-13C HSQC spectrum of the CaM:CaMKKap complex. Shown is a contour plot of first time point (7ms) from the IzCzDz experiment acquired at 750 MHz. Seventy-one of 78 methyl groups in calmodulin were adequately resolved for analysis.