
Figure 7.
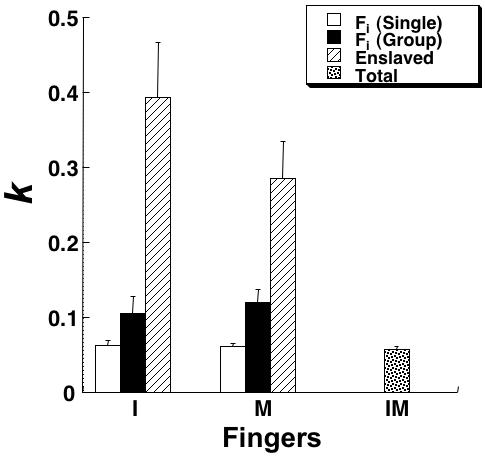
Experiment-3 (SNV). Regression coefficients (k, dimensionless) within the linear regression model computed across the different force levels for different tasks and fingers are shown averaged across subjects with standard error bars. The data for each finger in its own single-finger task (white bars), in the two-finger task (hatched bars), and in the task when the this finger was not instructed (enslaved, black bars). The last column (IM, dotted) shows the data for the total force in the IM task. Abbreviations are the same as in Figure 3.